

Presenter(s)
Michael Jablonski, Chasen Kern
Files
Download Project (1.0 MB)
Description
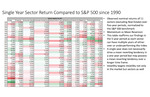
For our project, we calculated the single year return for each of the sectors of the S&P 500 (excluding real estate) since January 1, 1990. After calculating the single year return, we created a table to visualize returns compared to the benchmark. In this table, we can observe how industries returned nominally when directly related to the S&P 500. This table reaffirms our findings in the 5-year period as each sector can have multiple years of either over or underperforming the index. This allows us to conclude that performance in a single year does not necessarily drive a mean reverting tendency in a one-year period but may possess a mean reverting tendency over a longer time frame. The next step in confirming this would be creating a regression that lags the performance of each sector. This can help us determine with statistical confidence over various time periods. In the short-term momentum appears to be a determinate of results, but potentially shifting as the time gets stretched longer.
Publication Date
4-23-2025
Project Designation
Independent Research
Primary Advisor
Henry G. Willmore
Primary Advisor's Department
Economics and Finance
Keywords
Stander Symposium, School of Business Administration
Recommended Citation
"Single Year Sector Return Compared to S&P 500 since 1990" (2025). Stander Symposium Projects. 4149.
https://ecommons.udayton.edu/stander_posters/4149

Comments
9:00-10:15, Kennedy Union Ballroom