

Presenter(s)
Thy Anh Tran
Files
Download Project (453 KB)
Description
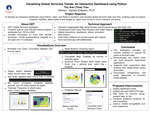
This project presents an interactive Global Terrorism Dashboard designed to explore terrorism incidents worldwide. Using Dash and Plotly, the dashboard provides a visual representation of attack patterns, target types, and fatalities, wounds across different regions and countries. Users can select a region and country to view relevant data through a choropleth map and a sunburst chart, offering insights into the scale and nature of terrorist activities. The dashboard aims to make complex data more accessible by allowing users to interactively filter and analyze terrorism trends. By visualizing fatality rates and attack distributions, this tool can help researchers, policymakers, and security professionals better understand the impact of terrorism in different areas. The project highlights the importance of data visualization in identifying patterns and making informed decisions based on historical data.
Publication Date
4-23-2025
Project Designation
Graduate Research
Primary Advisor
Hamed Zolbanin
Primary Advisor's Department
MIS, OM and Decision Sciences
Keywords
Stander Symposium, School of Business Administration
Recommended Citation
"Visualizing Global Terrorism Trends: An Interactive Dashboard Using Python" (2025). Stander Symposium Projects. 4190.
https://ecommons.udayton.edu/stander_posters/4190

Comments
3:00-4:15, Kennedy Union Ballroom